Minimum Wage Hourly by State 2026: Full 50-State Table
The federal minimum wage has been frozen at $7.25/hour since July 24, 2009. In response, 30 U.S. states plus DC have enacted higher state-level minimums — some by ballot initiative, some by legislation, and many indexed to inflation so they ratchet up every January 1. The result is the widest geographic spread in hourly pay floors in modern U.S. history: from $7.25/hour in Mississippi, Louisiana, and Tennessee to $20.00/hour for California fast-food workers under AB 1228.
This article gives you the complete 2026 state-by-state table — untipped, tipped, scheduled mid-year increases, and how each state compares to MIT's living wage benchmark. Use the hourly pay calculator to translate any of these rates into annualized, take-home pay for your specific filing status and state.
The Federal Floor: Still $7.25 in 2026
The federal minimum wage under the Fair Labor Standards Act (FLSA) Section 6 remains $7.25/hour. The federal tipped minimum is $2.13/hour, with the requirement that tips bring the worker to $7.25 (29 CFR § 531.59). Where a state or local minimum is higher, the higher number applies — workers receive the most favorable of the federal, state, and local minimums that cover them. The federal minimum binds in 20 states; the other 30 states plus DC are above it.
The 17-year federal freeze (longest in FLSA history) has produced significant erosion in real purchasing power. $7.25 in 2009 dollars has the buying power of approximately $4.87 in 2026, based on cumulative CPI inflation. If the 2009 minimum had been indexed to CPI, the federal floor would be roughly $10.80/hour in 2026.
50-State Untipped Minimum Wage Table (January 1, 2026)
Rates below reflect the statewide minimum wage effective January 1, 2026. Cities and counties may have higher local minimums; where a major city differs significantly, it's noted. Sources: U.S. Department of Labor Wage and Hour Division, National Employment Law Project (NELP) state legislation tracker.
| State | Minimum Wage | Indexed? | Notes |
|---|---|---|---|
| Alabama | $7.25 (federal) | No | No state law |
| Alaska | $13.00 | Yes (CPI) | Tipped same as untipped |
| Arizona | $15.10 | Yes | Flagstaff $18.46 |
| Arkansas | $11.00 | No | — |
| California | $16.50 | Yes | Fast food $20.00; healthcare tiered |
| Colorado | $14.81 | Yes | Denver $18.81 |
| Connecticut | $16.35 | Yes | — |
| Delaware | $15.00 | No | — |
| DC | $17.95 | Yes | Highest in U.S. |
| Florida | $14.00 | Scheduled $15 in 2026 | $15 by Sept 30, 2026 |
| Georgia | $7.25 (federal) | No | State law $5.15, federal preempts |
| Hawaii | $14.00 | Scheduled $16 in 2028 | — |
| Idaho | $7.25 (federal) | No | — |
| Illinois | $15.00 | No | Chicago $16.20 |
| Indiana | $7.25 (federal) | No | — |
| Iowa | $7.25 (federal) | No | — |
| Kansas | $7.25 (federal) | No | — |
| Kentucky | $7.25 (federal) | No | — |
| Louisiana | $7.25 (federal) | No | No state law |
| Maine | $14.65 | Yes (CPI) | Portland $15.50 |
| Maryland | $15.00 | No | Montgomery County $17.65 |
| Massachusetts | $15.00 | No | — |
| Michigan | $12.48 | Yes | Scheduled $14.97 by 2028 |
| Minnesota | $11.13 | Yes | Minneapolis $15.97; St Paul $15.97 |
| Mississippi | $7.25 (federal) | No | No state law |
| Missouri | $13.75 | Yes | — |
| Montana | $10.55 | Yes (CPI) | Tipped same as untipped |
| Nebraska | $13.50 | Scheduled $15 in 2026 | — |
| Nevada | $12.00 | Yes | Tipped same as untipped |
| New Hampshire | $7.25 (federal) | No | — |
| New Jersey | $15.49 | Yes | Small employers $14.53 |
| New Mexico | $12.00 | No | Santa Fe $14.60 |
| New York | $16.50 / $15.50 | Yes (after 2027) | $16.50 NYC/LI/Westchester; $15.50 rest |
| North Carolina | $7.25 (federal) | No | — |
| North Dakota | $7.25 (federal) | No | — |
| Ohio | $10.70 | Yes (CPI) | Small employers $7.25 |
| Oklahoma | $7.25 (federal) | No | — |
| Oregon | $14.70 std / $15.95 metro | Yes (CPI) | Tipped same as untipped |
| Pennsylvania | $7.25 (federal) | No | — |
| Rhode Island | $15.00 | No | — |
| South Carolina | $7.25 (federal) | No | No state law |
| South Dakota | $11.50 | Yes (CPI) | — |
| Tennessee | $7.25 (federal) | No | No state law |
| Texas | $7.25 (federal) | No | — |
| Utah | $7.25 (federal) | No | — |
| Vermont | $14.01 | Yes (CPI) | — |
| Virginia | $12.41 | Yes (CPI) | — |
| Washington | $16.66 | Yes (CPI) | Seattle $20.76; Tipped same |
| West Virginia | $8.75 | No | — |
| Wisconsin | $7.25 (federal) | No | — |
| Wyoming | $7.25 (federal) | No | State law $5.15, federal preempts |
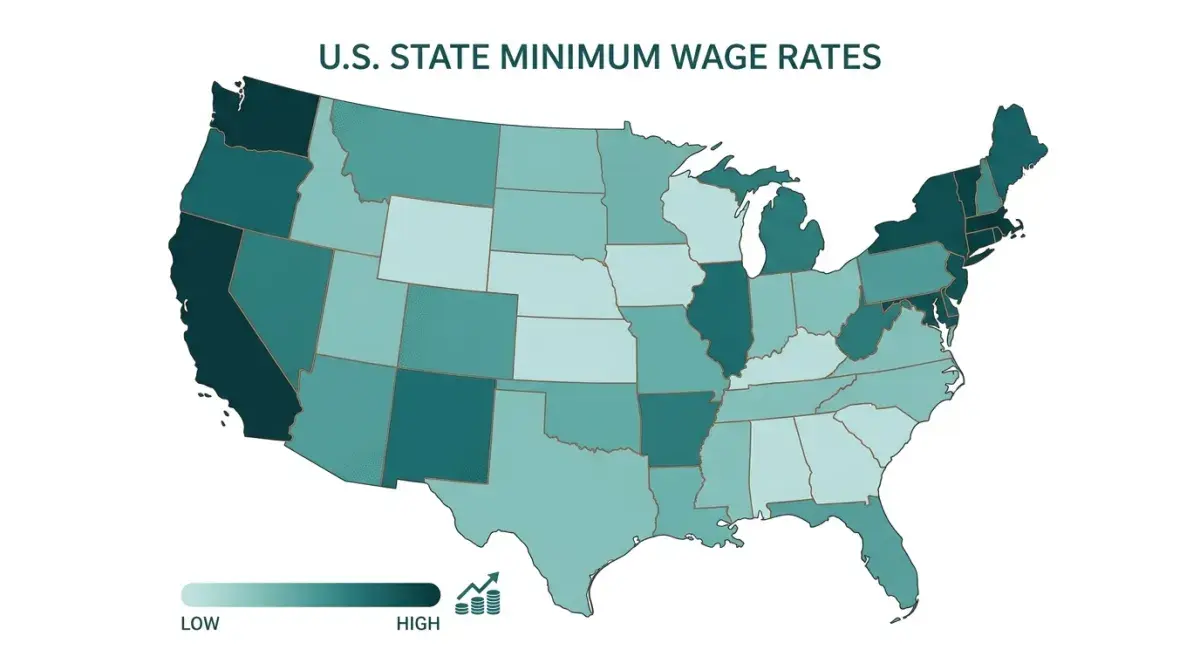
Twenty states sit at the federal $7.25 floor. Eleven states plus DC are at $15.00 or above. The remaining 19 states fall between $8.75 and $14.81. The geographic concentration is sharp: every Pacific and Northeast state except Pennsylvania and New Hampshire is above $14/hour, while the Southeast and most of the Midwest cluster at or near the federal floor.
Tipped Minimum Wage by State
The federal tipped minimum is $2.13/hour. Seven states require tipped workers to receive the full untipped state minimum: Alaska ($13.00), California ($16.50), Minnesota ($11.13), Montana ($10.55), Nevada ($12.00), Oregon ($14.70), and Washington ($16.66). Sixteen additional states have tipped minimums between $2.13 and $11.40 that exceed the federal floor. The gap between tipped and untipped minimums can be dramatic: in DC, untipped is $17.95 and tipped is $11.40 (a $6.55 spread that tips must cover).
The tipped credit only applies if total compensation (wages + tips) reaches at least the regular state minimum on a weekly basis. If it doesn't, the employer must make up the difference. For workers calculating their take-home pay from a mix of wages and tips, our hourly pay calculator can absorb both inputs.
Scheduled Mid-Year Increases for 2026
Several states have scheduled minimum-wage increases that take effect later in 2026:
- Florida: $14.00 → $15.00 on September 30, 2026 (final step of 2020 ballot initiative)
- Nevada: $12.00 → $12.50 on July 1, 2026 (CPI adjustment)
- Oregon: CPI adjustment effective July 1, 2026 (projected +$0.45-0.55)
- DC: $17.95 → projected $18.40 on July 1, 2026 (CPI adjustment)
- Connecticut: CPI adjustment effective January 1, 2027 (next adjustment)
- Hawaii: $14.00 → $16.00 on January 1, 2028 (scheduled step)
States with CPI-indexed minimums automatically recalculate annually based on the Consumer Price Index. The CPI adjustments take effect January 1 in most states, with Oregon and a few others using July 1 effective dates.
How Minimum Wage Translates to Annual Salary
At a full-time 40-hour week (2,080 hours/year), each state minimum produces a different annual gross:
| Hourly Rate | Annual Gross (2,080 hrs) | Approx Federal Take-Home (single, std deduction) |
|---|---|---|
| $7.25 (federal) | $15,080 | $13,490 |
| $10.70 (Ohio) | $22,256 | $19,200 |
| $12.00 (Nevada) | $24,960 | $21,410 |
| $14.81 (Colorado) | $30,805 | $26,300 |
| $15.00 (Illinois) | $31,200 | $26,615 |
| $16.50 (CA / NY) | $34,320 | $29,000 |
| $17.95 (DC) | $37,336 | $31,400 |
| $20.00 (CA fast food) | $41,600 | $34,650 |
The take-home column uses 2026 federal brackets with the standard deduction; it doesn't account for state income tax. For a precise net pay number that includes federal, FICA, and state tax for your state, use the take-home pay calculator. The full hourly-to-annual conversion math (overtime, partial weeks, holiday pay) is covered in hourly to annual salary 2026.
Minimum Wage vs Living Wage
MIT's Living Wage Calculator estimates the hourly wage a worker needs to cover basic costs — food, housing, transportation, healthcare, childcare, taxes — without public assistance. For a single adult with no children:
- National median living wage: $24.16/hour (2026 update)
- San Francisco County, CA: $33.45/hour single adult
- New York County, NY (Manhattan): $32.18/hour single adult
- Suffolk County, MA (Boston): $30.41/hour single adult
- Travis County, TX (Austin): $24.85/hour single adult
- Miami-Dade County, FL: $25.92/hour single adult
- Marion County, IN (Indianapolis): $19.74/hour single adult
- Single parent of 2 children, national median: $49.30/hour
Every state minimum wage in 2026 falls below MIT's single-adult living wage for the median U.S. metro by 35-70%. Even the highest state minimum (Washington at $16.66) falls 31% short of the national median living wage. This gap is the central policy debate driving local minimum-wage legislation since 2014.
Negotiating Above Minimum: What Workers Should Know
In most U.S. labor markets, minimum-wage jobs in retail, food service, and warehousing are increasingly paying 25-50% above the legal minimum because tight labor markets have pulled wages up faster than legislation. Bureau of Labor Statistics data shows the average hourly wage for restaurant cooks was $17.18/hour in late 2025 nationally — well above the federal $7.25 minimum and even above several state minimums.
If you're negotiating a wage offer, anchor to:
- BLS Occupational Employment and Wage Statistics for your specific role and metro
- Indeed and Glassdoor salary data for the company and metro
- The MIT Living Wage for your county as a floor justification
- Your state minimum wage as the legal floor
For W-2 employees pivoting to freelance work, the rate-setting math differs significantly. See freelance hourly rate real math 2026 and our newer freelance hourly rate by industry piece for the salary × 1.5 ÷ billable-hours formula. To plan training time around a minimum-wage or hourly job schedule, see CalcFit's 4-day upper/lower split for the lowest-time-cost effective training template.
What's Next: 2027 and Beyond
Twelve states have legislation or ballot initiatives scheduled to raise their minimum wages between 2027 and 2030:
- Hawaii: $16.00 (Jan 1, 2028)
- Michigan: $14.97 by 2028
- Nebraska: CPI indexing begins 2027
- Several CPI-indexed states projected to cross $17/hour by 2028 (Washington, California, DC)
Federally, multiple Raise the Wage Act versions have been introduced since 2019 to raise the federal minimum to $17/hour by 2028; none has passed both chambers as of 2026. The continued federal freeze, combined with accelerating state and local action, means the geographic minimum-wage spread will keep widening through 2028 — likely producing a 4-5x ratio between the lowest and highest U.S. minimum wages by 2030.
The Bottom Line
In 2026, the U.S. minimum wage landscape spans $7.25 (20 states) to $20.00 (California fast food workers under AB 1228), with 11 states plus DC above $15.00. The federal floor remains frozen at the 2009 level, eroding to roughly $4.87 in real purchasing power. Every state minimum sits below MIT's single-adult living wage — by 30% in Washington and DC, and by 70%+ in the federal-minimum states. Use the hourly pay calculator to translate any rate into annualized take-home for your specific state and filing status, and the take-home calculator for full federal + state + FICA withholding precision.
Frequently Asked Questions
Calculate Your Hourly Take-Home
Plug your hourly rate, state, and filing status into PayScale Pro's hourly pay calculator for net pay after federal, FICA, and state withholding.